Pitching Data and Original Research to Journalists
How to prepare genuine data for a pitch, and present it honestly enough that journalists trust and use it.

Original data is one of the strongest assets in outreach, journalists and bloggers actively look for genuine numbers to cite, but only if the data is real, clearly sourced, and presented without overstatement. This post covers preparing and pitching data honestly and effectively.
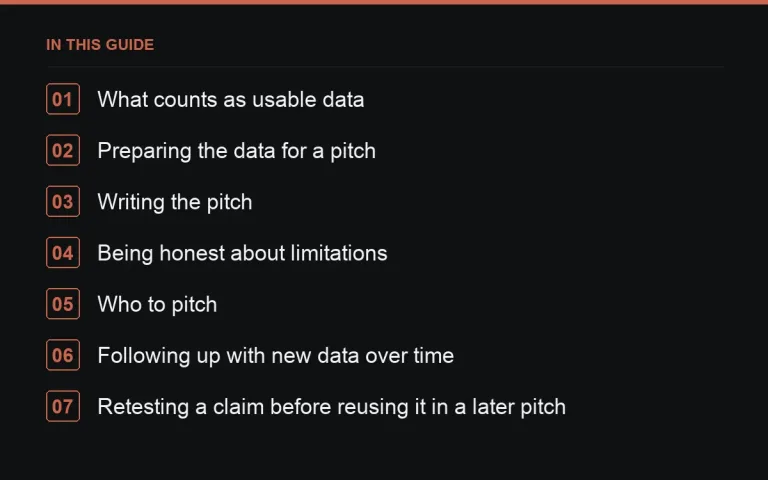
What counts as usable data
This can be internal data your business genuinely has, anonymised customer or usage patterns, survey results you collected yourself, or an original analysis of publicly available data sets. What matters is that it is real, defensible, and clearly explained, not that it is large or dramatic. A modest but genuine data point beats an exaggerated one every time a journalist checks the sourcing.
Preparing the data for a pitch
- Document your methodology plainly: sample size, time period, how it was collected. Journalists will ask, and vague answers kill credibility fast.
- Present the core finding in one clear sentence before any supporting detail.
- Avoid rounding or framing that exaggerates the finding beyond what the data actually supports.
- Prepare a simple chart or table if the data supports one; visual assets make a pitch easier to use.
Writing the pitch
Lead with the finding itself, not your company. State what you found, why it is relevant right now, and offer the full data set or methodology on request. Keep the initial pitch short; journalists decide fast whether a data point is interesting enough to pursue further.
Being honest about limitations
If your sample size is small, or your data covers only one specific market or customer segment, say so upfront rather than letting a journalist discover the limitation later and lose trust in the pitch, and in you, as a source. A limited but honestly-framed data point is more useful, and more likely to be used again in future, than an overstated one.
Who to pitch
Data-driven pitches work particularly well with journalists on a relevant beat and with bloggers who write data-heavy, analytical content; see https://successtoroad.com/blog/journalists-vs-bloggers-outreach-differences/ for how the pitch itself should differ between the two audiences.
Following up with new data over time
If your data updates regularly, a quarterly or annual trend can become a recurring pitch opportunity, journalists and bloggers who used the data once are a reasonable audience to notify when a fresh update is available, provided you are not simply repeating the same finding without anything new to add.
Retesting a claim before reusing it in a later pitch
If a data point is more than a year or two old, verify it still holds before reusing it in a fresh pitch rather than assuming it remains accurate indefinitely; conditions in most industries change enough over that time that an outdated figure presented as current can quietly undermine an otherwise strong pitch.
Keeping data pitches distinct from marketing claims
Data prepared for a journalist pitch should be kept separate, in tone and framing, from data used in your own marketing materials, where a more promotional framing is expected and understood by the audience. A pitch that reads like it was lifted directly from a marketing page tends to raise a journalist’s scepticism rather than lowering it, since journalistic sourcing standards are simply different from marketing conventions.
Turning down a request you cannot verify
Occasionally a journalist will ask for a specific breakdown or figure your data cannot actually support, a finer segment than your sample allows, for instance. It is far better to say plainly that your data does not support that specific cut than to approximate an answer that overstates what you actually know; a journalist who catches an inflated claim once is unlikely to treat you as a reliable source again.
Working with a data visualisation, even a simple one
A basic bar chart or line graph accompanying your pitch, even built with ordinary spreadsheet software, makes the finding easier for a busy journalist or blogger to grasp and easier to justify including in their own piece. It does not need to be elaborate; clarity matters far more than visual polish for this purpose.
Related asset: statistics pages
If you regularly produce data of this kind, consolidating it into a dedicated statistics page on your own site gives you a durable, citable asset beyond any single pitch; see statistics pages: the most reliable linkable asset for building that out properly.
Combining internal data with external context
A data pitch often lands better when it is framed against some broader, independently verifiable context rather than presented in complete isolation, for instance, noting how a finding relates to a well-established industry trend a journalist would already recognise. Be careful here to keep your own data and any external context clearly distinguished in the pitch, so the journalist can see exactly what you measured yourself versus what you are simply referencing for context.
Where to go next
See https://successtoroad.com/blog/pitching-expert-comment-and-quotes/ for pitching your team’s expertise alongside or instead of data, and https://successtoroad.com/blog/link-outreach-guide/ for the overall outreach process. If your business does not yet have data worth pitching, https://successtoroad.com/marketplace/ remains a reliable, non-data-dependent route to relevant links in the meantime.
Frequently asked questions
What if my sample size is small?
State it plainly rather than hiding it; a small but honestly-described sample is still usable, especially for a niche-specific story, as long as the limitation is disclosed upfront.
Should I offer the raw data set to journalists?
Offering it on request, rather than sending it unsolicited in the first pitch, is usually the right approach and signals confidence in the underlying numbers.
How often can I pitch updates from the same data source?
As often as there is genuinely new information to share; repeatedly pitching the same finding without anything new tends to wear out journalist interest quickly.
Do I need a professional design for data charts before pitching?
A clean, simple chart is enough; elaborate design is less important than the data being clear, accurate and easy to verify.
Put it into practice
Filter 54,483 websites by DR, traffic, niche and price, and order with escrow — you pay only after the link is live.
Browse the marketplace