Creating Visual Assets Journalists Will Actually Use
What separates a visual asset a journalist embeds in their article from one they ignore and describe in their own words instead.
A journalist deciding whether to cover your campaign is also, often unconsciously, deciding whether it’s easy to illustrate. A story with a ready-to-use chart or image gets covered faster and more often than one where the journalist has to build their own graphic from your raw numbers.
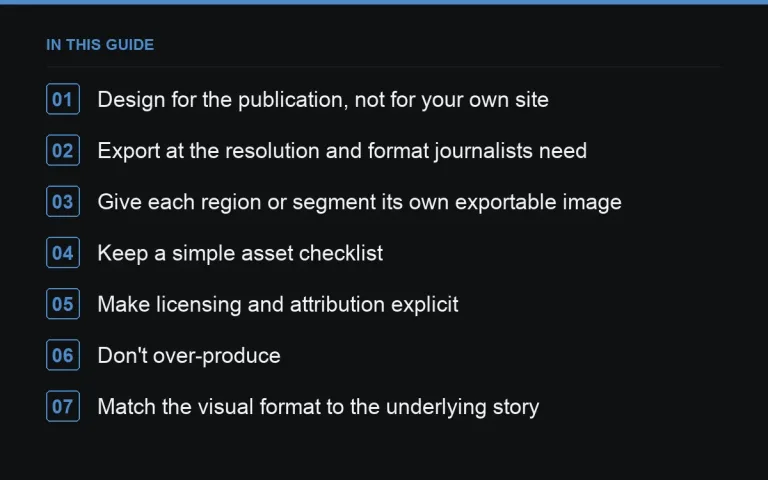
Design for the publication, not for your own site
A chart styled beautifully for your brand’s landing page may look cluttered or off-brand when embedded in a news article. Provide a plain, minimal version — clear labels, no heavy branding, readable at a small embedded size — separate from any more elaborate interactive version on your https://successtoroad.com/blog/campaign-landing-page-design/.
Export at the resolution and format journalists need
Provide static images at a resolution that holds up when scaled for a website header or social share, typically well above standard screen resolution. Offer both a horizontal and a vertical crop where possible, since publications vary in layout, and always include a plain PNG or JPG alongside any interactive embed code.
Give each region or segment its own exportable image
For https://successtoroad.com/blog/map-based-pr-campaigns/ or https://successtoroad.com/blog/regional-angles-from-national-data/, prepare a separate cropped image highlighting each area, not just one national overview. A regional journalist is far more likely to use an image already focused on their patch than to crop your national graphic themselves.
Keep a simple asset checklist
- One clean hero chart or map, branding minimal.
- Regional or segment-specific crops, if relevant.
- A one-line caption for each image stating the key fact it shows.
- A short methodology note journalists can quote directly.
Make licensing and attribution explicit
State clearly, in the pitch email and on the landing page, that images are free to use with attribution and a link back. Ambiguity here causes some journalists to skip the visual entirely rather than risk a rights issue — a single sentence removes the hesitation.
Don’t over-produce
Elaborate animated graphics or heavily designed infographics take longer to build and are often harder for a publication to use than a clean, simple chart. Unless the campaign specifically calls for a rich interactive experience, prioritise clarity and speed of production over visual complexity — this also keeps https://successtoroad.com/blog/campaign-budgets/ realistic.
Match the visual format to the underlying story
A ranking or index, per https://successtoroad.com/blog/index-and-ranking-campaigns/, usually needs a clean bar chart or table image rather than an elaborate illustration. A geographic story, per https://successtoroad.com/blog/map-based-pr-campaigns/, needs the map itself as the primary visual, with a legend simple enough to read at a glance. Choosing the visual type to match the story, rather than defaulting to whatever look the design team prefers, keeps the asset genuinely useful rather than merely decorative.
Build a simple naming and folder system for assets
When a campaign produces a dozen or more image variants — national, regional, vertical, horizontal — a clear, consistent file-naming system prevents the wrong version being sent to the wrong journalist. A folder structured by region or segment, with a short readme listing which caption belongs to which file, saves real time once outreach is underway and multiple people are sending pitches from the same asset pack.
Test how the asset looks once actually embedded
Before finalising, paste your image into a plain document or a sample article layout and check it at a smaller display size, not just full-screen on your own monitor. Text that’s legible in your design tool can become unreadable once shrunk to fit a typical article’s image width — a five-minute check like this catches a surprising number of otherwise-finished assets that would have looked poor in print.
Prepare assets for social sharing too
Journalists and readers alike often share coverage on social platforms, and a square or vertical crop optimised for that context extends the campaign’s reach beyond the article itself. Prepare at least one alternate crop specifically for this purpose alongside the standard landscape version used in most articles.
Keep a version history as data updates
If the underlying figures change after initial publication — a correction, a later data revision, an annual refresh — keep a dated version history of each visual asset. This avoids the confusing situation where different journalists, pitched at different times, end up publishing slightly different versions of the same chart without anyone noticing the discrepancy until a reader points it out.
Provide a short alt-text description for every image
Alt text isn’t just a technical accessibility requirement — it also helps a journalist working quickly understand what an image shows without opening it first, and it improves the chances of appropriate use if the image is shared or embedded through a system that surfaces alt text automatically. Write a plain, factual description for each asset rather than leaving this field blank or generic.
Where to go next
Pair strong visuals with a sharp https://successtoroad.com/blog/headline-writing-for-campaigns/ and make sure your outreach list is segmented so the right regional crop reaches the right journalist, following the wave structure in https://successtoroad.com/blog/follow-up-outreach-waves/. Ground the visuals in a page built along the lines of https://successtoroad.com/blog/campaign-landing-page-design/, and where the underlying story spans regions, use https://successtoroad.com/blog/regional-angles-from-national-data/ to decide which crops matter most. https://successtoroad.com/marketplace/ and https://successtoroad.com/services/writing/ can help scale asset production and outreach copy for larger campaigns.
Frequently asked questions
What image format should we send journalists?
PNG or JPG at high resolution covers most needs. Avoid sending only vector or interactive-only formats, since many journalists work quickly in tools that expect a straightforward raster image.
Should we brand our charts heavily?
Keep branding minimal — a small logo or source credit in a corner is enough. Heavy branding makes publications less likely to use the image as-is, since it can look like an advertisement rather than editorial data.
How many visual assets does a typical campaign need?
A hero chart or map plus a handful of regional or segment crops usually covers most pitches. Producing dozens of variations rarely adds value beyond what a well-chosen handful achieves.
Do interactive charts help or hurt coverage chances?
They can add engagement on your own landing page but rarely get embedded directly in articles. Treat interactive elements as a bonus for your own site, not a replacement for static, embeddable images.
Put it into practice
Filter 54,483 websites by DR, traffic, niche and price, and order with escrow — you pay only after the link is live.
Browse the marketplace