Designing Map-Based Digital PR Campaigns
Why maps work as a PR format, and the practical decisions that determine whether one gets covered or ignored.
A map turns a spreadsheet into something a reader can explore in ten seconds, which is exactly why regional and local press pick them up so readily. But maps are also one of the easier formats to get wrong: too much data crammed into one view, no clear regional story, or a design that only works on desktop.
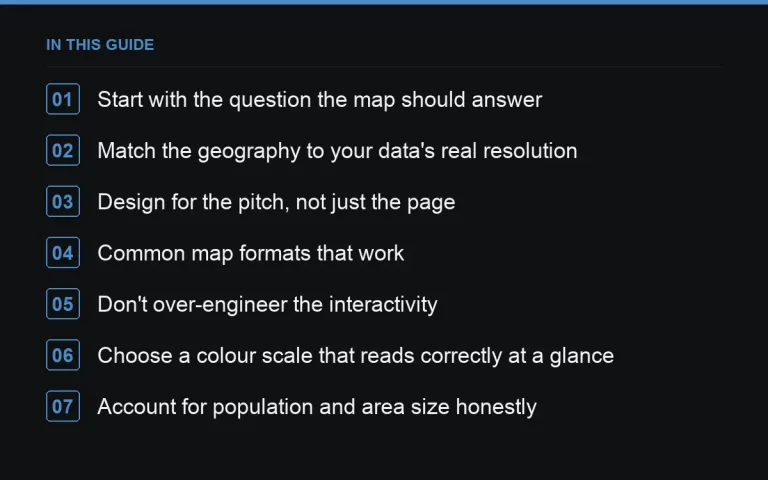
Start with the question the map should answer
A map without a clear question — where is X highest, where is Y most common, how does Z vary by region — is just a pretty visualisation with no story. Write the question first, then check whether your data has enough geographic granularity to answer it meaningfully at town, county, or regional level.
Match the geography to your data’s real resolution
Don’t force postcode-level precision onto data that’s only reliable at regional level. Journalists and readers will spot inconsistent granularity — a map that’s detailed in one area and sparse elsewhere looks unfinished. If your data only supports regional-level accuracy, build a regional map and let https://successtoroad.com/blog/regional-angles-from-national-data/ do the more granular storytelling in the write-up instead.
Design for the pitch, not just the page
Most journalists will never open your interactive map — they’ll ask for a static image of their region or a specific data point. Prepare static, journalist-ready exports for each major region alongside the interactive version, following the practices in https://successtoroad.com/blog/visual-assets-for-journalists/. This single step often determines whether a regional desk covers you at all.
Common map formats that work
- Choropleth (colour-shaded regions): best for a single metric compared across areas.
- Point map: best for specific locations — venues, incidents, facilities.
- Change-over-time map: strongest for an https://successtoroad.com/blog/evergreen-vs-one-off-campaigns/ asset you can update annually.
Don’t over-engineer the interactivity
A map with filters, toggles, and hover tooltips is satisfying to build but slower to load and harder for a journalist to screenshot cleanly. Keep the core view simple and clear at a glance; save advanced filtering for a secondary “explore the full data” mode that isn’t the default landing state.
Choose a colour scale that reads correctly at a glance
Colour choice matters more on a map than on almost any other chart type, because readers interpret shade as meaning before they read a single label. Use a single continuous scale for a single metric running low to high, and avoid using colours that could be misread as a political or brand association unrelated to your data. Test the map in greyscale to make sure the pattern is still legible for readers with colour vision deficiencies, since a map that only works in full colour will lose a meaningful share of its audience.
Account for population and area size honestly
A raw count map will always highlight the largest population centres, which can flatten a more interesting story about rate or intensity per capita. Decide deliberately whether your map should show absolute totals or a normalised rate, and state that choice clearly in the caption — conflating the two, or switching between them without saying so, is a common source of reader confusion and later correction requests.
Handle boundary changes and administrative quirks
Regional and local authority boundaries change periodically, and older datasets sometimes use boundaries that no longer match current administrative areas. Confirm which boundary version your data uses and, where possible, present the map using current boundaries so regional journalists checking their own area against the map don’t find it doesn’t match their actual patch. A mismatch here is a small technical detail that quietly undermines confidence in otherwise solid data.
Provide a text-based summary alongside the map
Not every reader, and not every screen reader, can interpret a visual map effectively. A short accompanying table listing the top and bottom entries in plain text serves accessibility needs and also gives journalists a quotable, structured summary they can reference without needing to describe the map itself in their own writing.
Test load time on an average mobile connection
A visually rich interactive map can be slow to load on a typical mobile connection, and a journalist checking a pitch on their phone between meetings will not wait long for a page to render. Test the page under throttled network conditions, not just on a fast office connection, and set a fallback static image to load first if the interactive version is genuinely heavy.
Plan the regional outreach separately from the national pitch
A national pitch about the map as a whole and a regional pitch about “how your area compares” are two different emails, sent to two different lists, often in two different waves. Treat the regional wave as a https://successtoroad.com/blog/follow-up-outreach-waves/ rather than bundling it into the initial send, so regional journalists get a version of the pitch written specifically for their patch.
Where to go next
Once the map is built, tie it to a proper landing page — see https://successtoroad.com/blog/campaign-landing-page-design/ — and plan how you’ll track pickup across regions in https://successtoroad.com/blog/measuring-campaign-links-and-coverage/. If you need extra reach beyond organic outreach, https://successtoroad.com/niche/news-and-media/ publishers on https://successtoroad.com/marketplace/ are a solid route for regional visibility.
Frequently asked questions
What tool should we use to build the map?
This depends on your team's technical resources; the choice matters less than the underlying data quality and the static exports you prepare for journalists. Any tool that lets you export clean regional images will do the job.
How much data do we need before a map is worth building?
Enough geographic units to show meaningful variation — a map with only three or four regions rarely reads as insightful. If your data only covers a handful of areas, a table or short list may work better.
Do map campaigns work for niche B2B topics?
Yes, particularly for regional business data — office costs, hiring trends, or industry concentration by area. The audience is smaller but the regional press interest can still be strong, as covered in {{post:campaigns-for-b2b-software}}.
Should the map be mobile-friendly?
Yes. A large share of readers will view coverage on mobile, and a map that only works with a mouse-driven hover state will frustrate them and hurt time-on-page even if journalists cover the story.
Put it into practice
Filter 54,483 websites by DR, traffic, niche and price, and order with escrow — you pay only after the link is live.
Browse the marketplace