Building an Index or Ranking Campaign the Right Way
A guide to building city, brand, or product rankings that hold up to scrutiny instead of collapsing under the first pushback email.
Ranking and index campaigns — “best cities for X”, “most Y-friendly brands” — are one of the most reliable digital PR formats because journalists and readers both like a league table. They are also the format most likely to attract public criticism if the methodology is weak, so the build has to be treated as seriously as the outreach.
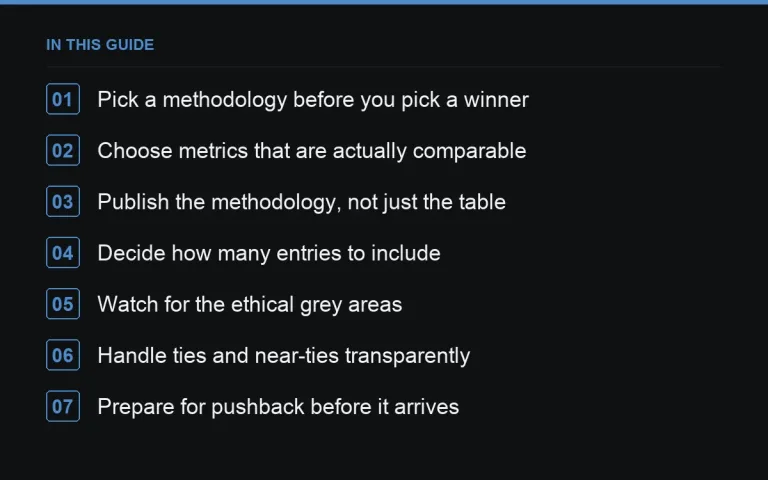
Pick a methodology before you pick a winner
Decide the weighting and the metrics before you know which city or brand will top the table. Teams that reverse this — choosing an appealing result first and reverse-engineering weights to fit — get caught, because a follow-up journalist question or a public comment thread will usually spot the pattern. This is the single most important ethical rule of the format.
Choose metrics that are actually comparable
Every entry in the index needs data available at the same level of granularity, from the same or comparable sources. Mixing a metric only available for large cities with one only available nationally produces a table with gaps that undermine trust. If you can’t get consistent data for all entries, shrink the list rather than fill gaps with estimates.
Publish the methodology, not just the table
A short methodology section is not optional. State the data sources, the date range, how missing data was handled, and how metrics were weighted or normalised. This does three things: it protects you from accusations of cherry-picking, it gives journalists something to quote beyond the ranking itself, and it makes the piece defensible if a competitor challenges the result.
Decide how many entries to include
Ranking every entity in a category is rarely necessary and often weakens the story. A focused top 10 or top 20 with a clear cutoff reads better than a table of 150 rows nobody will scroll through. Use this rough guide:
- Top 10–15: strongest for national press pickup and a clean headline.
- Full list with search/filter: better suited to an https://successtoroad.com/blog/evergreen-vs-one-off-campaigns/ people return to.
- Regional breakdown of a national index: strong source for https://successtoroad.com/blog/regional-angles-from-national-data/.
Watch for the ethical grey areas
Rankings that touch health, safety, crime, or protected characteristics need extra caution — a “worst cities for X” framing can read as punitive rather than informative, and outlets increasingly scrutinise this before publishing. Where the topic is sensitive, favour neutral, descriptive framing over “best/worst” language, and see https://successtoroad.com/blog/responsible-health-campaigns/ if the subject touches wellbeing at all.
Handle ties and near-ties transparently
Real-world data rarely produces a clean, evenly spaced ranking — several entries often cluster within a fraction of a point of each other. Decide in advance how you’ll present near-ties: listing them at the same rank with a note, or using a secondary metric to break the tie, and say which approach you used in the methodology. Silently picking a winner among near-identical scores without disclosing the tie-break rule is one of the more common credibility complaints a ranking campaign attracts.
Prepare for pushback before it arrives
Someone ranked poorly will sometimes contact you, publicly or privately, disputing the result. Have a short, calm response ready that points to the published methodology and offers to correct any factual error in the underlying data, without promising to change the ranking itself just because an entrant dislikes the outcome. Teams that haven’t thought about this in advance tend to either over-apologise or go silent, both of which look worse than a measured, methodology-grounded reply.
Decide how often to refresh the index
An index built on annually updated public data has a natural refresh cadence built in; one built on a commissioned survey needs a deliberate decision about whether repeating it yearly is worth the cost. A refreshed index that shows genuine year-on-year movement is significantly more interesting to press than a static one republished unchanged, so factor this into the original methodology design — choosing metrics that will plausibly show meaningful change over time, not just ones that are convenient to measure once.
Decide how granular the entries need to be
Ranking individual towns produces a longer, noisier table than ranking larger regions, and the right level of granularity depends on what your data can reliably support at each scale. A table stretched to town level on data that’s only robust at regional level looks more detailed than it actually is, and the gap tends to surface exactly when a journalist from a specific town checks their own entry against other local knowledge.
Plan the pitch angles in advance
An index naturally produces more than one story: the national top line, the regional breakdown, the surprising mid-table entry, the year-on-year change if you repeat it. Map these out before launch using the approach in https://successtoroad.com/blog/pitching-angles-from-one-dataset/ so outreach doesn’t stall after the first wave of coverage.
Where to go next
Pair the index with a clear landing page — see https://successtoroad.com/blog/campaign-landing-page-design/ — and plan your https://successtoroad.com/blog/measuring-campaign-links-and-coverage/ before launch. When you’re ready to place supporting content, https://successtoroad.com/marketplace/ and https://successtoroad.com/niche/business/ publishers are a practical route to broaden coverage beyond organic pickup.
Frequently asked questions
How many metrics should a ranking index use?
Three to six weighted metrics is a practical range. Fewer can look thin and arbitrary; more than six makes the methodology hard to explain in a sentence and harder for readers to trust.
Is it fine to rank brands or companies directly?
Yes, if the metrics are public, verifiable, and applied consistently. Avoid framing that implies a value judgement beyond what the data supports, and be ready to explain the methodology if a ranked company objects.
Should we update the index every year?
Only if the underlying data source updates on a similar cycle and the update produces a genuinely different result. Republishing an unchanged ranking with a new date does not interest journalists.
What if our top result is controversial?
Let the methodology carry the weight of the claim rather than editorialising in the headline. If a result seems too provocative to defend under questioning, revisit the weighting rather than softening the language around it.
Put it into practice
Filter 54,483 websites by DR, traffic, niche and price, and order with escrow — you pay only after the link is live.
Browse the marketplace