Data Visualisation Outreach: Turning Numbers Into Linkable Charts
How to package existing data into charts that publishers want to embed, credit, and link back to.
You do not need to run your own survey to produce a linkable visualisation — publicly available datasets from government agencies, industry bodies, and open data portals can be turned into a clear, well-labelled chart that a writer would rather embed than rebuild themselves. This is a lighter-weight alternative to full https://successtoroad.com/blog/content-that-earns-links/ campaigns built around original research.
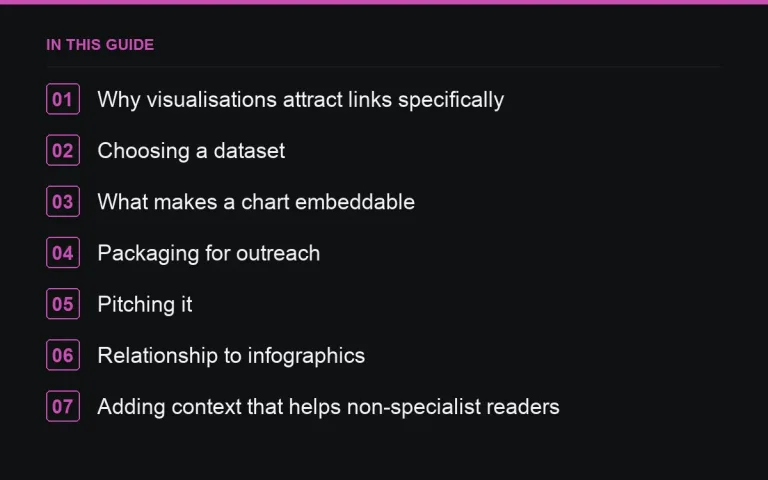
Why visualisations attract links specifically
A writer covering a topic often needs a chart, and building one from raw data takes time they may not have. If you have already done that work and made the result easy to credit and link to, you remove the single biggest piece of friction between “interesting dataset” and “published chart in someone else’s article.”
Choosing a dataset
- Government statistics portals relevant to your industry
- Trade association reports that publish raw figures alongside commentary
- Public research repositories and open data initiatives
- Your own aggregated, anonymised usage data, if you have enough of it to be meaningful
Whatever the source, cite it clearly. Never present someone else’s data as your own research, and never round or reshape numbers in a way that misrepresents the underlying source.
What makes a chart embeddable
| Embeddable | Skipped by writers |
|---|---|
| Clear title stating exactly what is measured | Ambiguous axis labels or unclear units |
| Clean, on-brand but not over-branded design | Heavy logo watermarks across the chart area |
| Simple embed code or a downloadable image | Chart only viewable inside an interactive tool |
| Source and date clearly credited | No indication of where the numbers came from |
Packaging for outreach
Build a short page presenting the chart alongside two or three sentences of plain-language interpretation — what the data shows and why it matters to your target audience. Journalists and bloggers are more likely to link to a page with context than to a bare image file, since the page gives them something to reference in their own text.
Pitching it
Target writers who cover the underlying topic regularly, not just anyone in your niche. Reference a recent piece of theirs and explain specifically how the chart would support a point they made or could make in a follow-up. Offer the embed code directly in the email rather than making them ask for it.
A short pitch checklist
- Confirm the recipient has written about this topic before
- Lead with the single most surprising or useful figure in the dataset
- Attach or link the chart, plus embed code
- Keep the ask to one sentence: would this be useful for a piece you’re working on?
Relationship to infographics
Data visualisation outreach is a narrower, more journalist-friendly cousin of https://successtoroad.com/blog/infographic-link-building/. Infographics work well for broad, shareable topics; single clean charts work better for writers who want to drop a specific data point into an article without redesigning their page around a full graphic.
Adding context that helps non-specialist readers
Raw numbers rarely speak for themselves to a general audience. Alongside the chart, include a brief plain-language explanation of what a reasonable person should take away from the trend shown, without overstating certainty the data does not support. This additional layer of interpretation is often what makes a writer confident enough to reference the chart in their own words rather than skipping it as too technical for their readers.
Building a small library instead of a single chart
Rather than producing one chart and moving on, consider working through a dataset systematically and producing a small set of related charts covering different angles of the same topic. This gives you multiple pitches from a single research effort, each one framed around a different specific finding, which multiplies the outreach opportunities without multiplying the research workload proportionally.
Keeping the data current
Public datasets get updated periodically, and a chart built on last year’s figures can quietly become inaccurate even though the page itself has not changed. Set a reminder to check the underlying source every six to twelve months and refresh the chart if newer figures are available, noting the update date clearly so anyone who previously linked to it can see the page is still maintained.
A note on interactive versus static charts
A static image is the easiest thing for a writer to embed with no technical friction, while an interactive chart can be more engaging for direct visitors to your own site but harder for another publisher to embed cleanly. If your primary goal is outreach and embedding, lean toward simple static images with clean embed code; if the goal is to keep visitors exploring on your own domain, an interactive version may serve you better even though it earns fewer external embeds.
Where to go next
If you want to build a recurring content asset instead of a one-off chart, look at https://successtoroad.com/blog/statistics-pages-for-links/, and revisit https://successtoroad.com/blog/link-building-checklist/ before your next push. Read https://successtoroad.com/blog/infographic-link-building/ if you want to compare this approach against a full visual infographic, and see https://successtoroad.com/blog/content-that-earns-links/ for the broader linkable-asset framework. When you are ready to place data-backed guest content directly rather than pitching a standalone chart, https://successtoroad.com/marketplace/ lists publishers by niche and traffic tier.
Frequently asked questions
Can I use government statistics without permission?
Most public government datasets are freely reusable with attribution, but always check the specific licence terms of the portal you are pulling from before publishing derived charts.
Do I need design software to build these charts?
No — many free and low-cost charting tools produce clean, embeddable visualisations. The design does not need to be elaborate; clarity and correct labelling matter more than visual flourish.
How is this different from commissioning original research?
Original research involves collecting new data yourself, which takes more time and resources. Data visualisation outreach repackages existing public data, so it is faster to produce but relies on someone else's dataset.
Should I offer the chart exclusively to one publisher?
Offering a short exclusivity window to a strong target can increase your odds with that one placement, but plan to release it more broadly afterward so the effort pays off across several links.
Put it into practice
Filter 54,483 websites by DR, traffic, niche and price, and order with escrow — you pay only after the link is live.
Browse the marketplace